I frequently use WebAIM’s WAVE browser extensions—they’re great tools for accessibility testing of websites and online applications and VPAT preparation. For the last seven years, WebAIM has gathered data on the accessibility of the top 1,000,000 homepages and provided their findings in the “WebAIM Million” report. The latest version dropped in late March 2025. Let’s have a look….
General Accessibility Trends 2025
Small Improvements
The report shows a small improvement in web accessibility on average with the average number of detectable errors per homepage declining 10.3% from 56.8 in 2024 to 51 in 2025.
Very Few Homepages Pass Completely
However, nearly 95% of tested homepages still showed detectable WCAG 2 failures. This figure has remained remarkably stagnant having decreased only 3% or so over the last five years.
Side Note for WebAIM
It would be interesting to see annual data showing the % of homepages with say, 10, 15 or 25 detectable errors. Perfection is often hard to achieve, and looking solely at homepages with zero detectable error, might hide improvements or even further issues lower in the data.
Deepening Accessibility Divide
Data suggests a deepening divide between those pages with fewer overall accessibility errors and those with many.
“Over the last several years the proportion of pages with fewer errors has increased while the number of pages with many errors has also increased—pages with fewer errors have gotten better while pages with many errors have gotten worse.”
Most Common Accessibility Issues
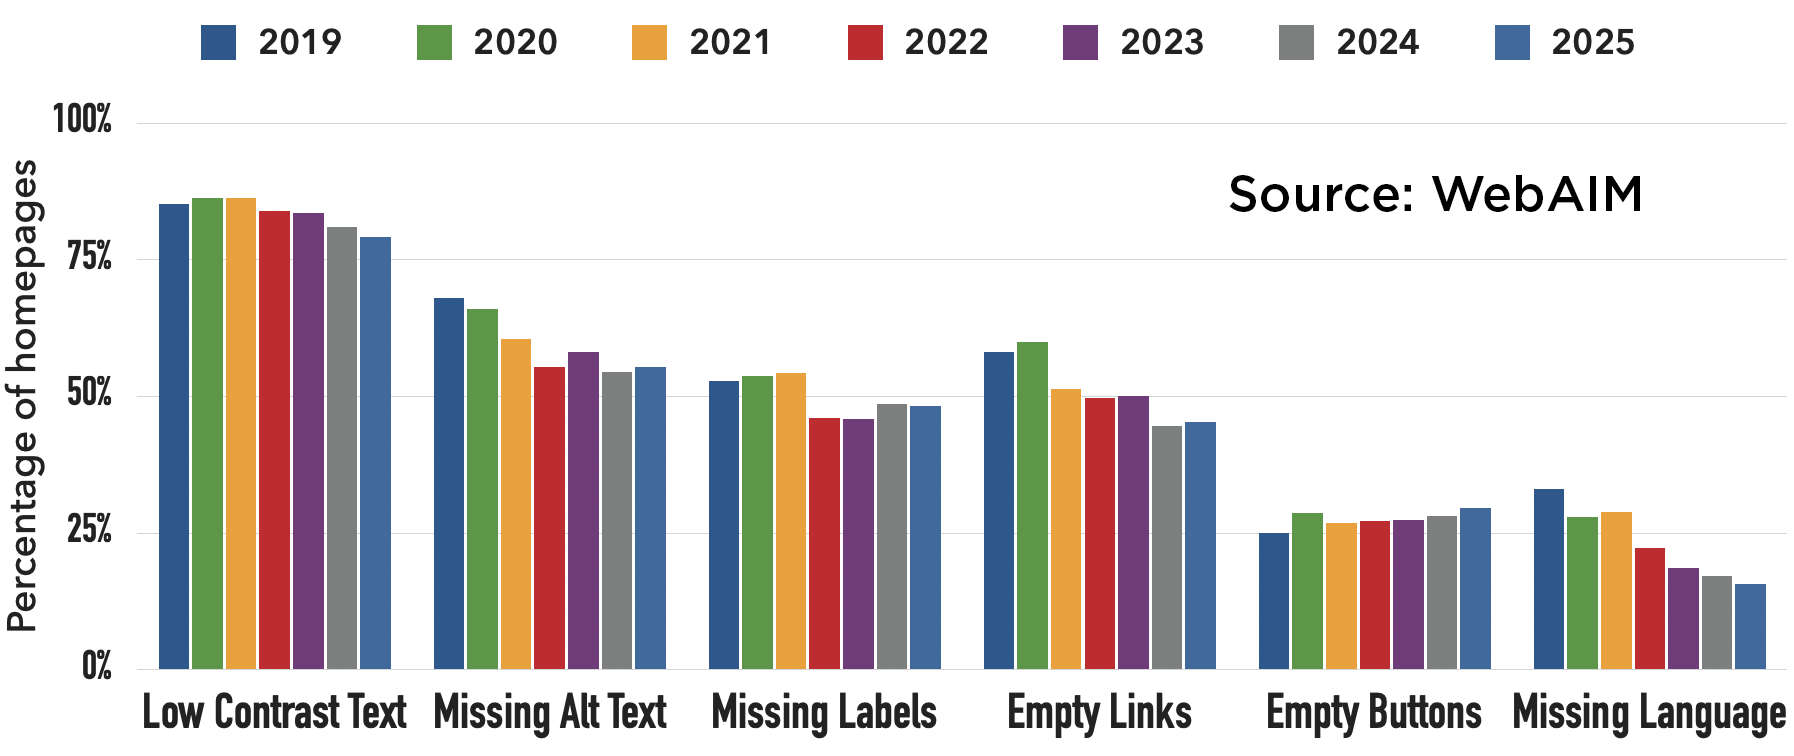
Six key categories of accessibility issues account for 96% of all detected errors:
These are:
- Low contrast text (79.1% of pages)
- Missing alternative text for images (55.5%)
- Missing form input labels (48.2%)
- Empty links (45.4%)
- Empty buttons (29.6%)
- Missing document language (15.8%)

Missing Alt Text is Major Accessibility Opportunity for AI
Many of these issues show year over year reductions, however “Missing Alternative Text for Images” shows a flat performance over the last several years while being one of the easier to remediate accessibility errors. Hopefully, CMS integration with AI tools that can identify and classify image content, and then provide recommended Alt text, will start to drive this figure down once again. WebAIM notes that of images with Alt text, “13.4% of images with alternative text had questionable or repetitive alternative text.” This group in particular represents low hanging fruit for AI automation and assistance. Emerging tools like this AI Text Generator should be prove very useful.
Homepage Forms?
Interestingly, WebAIM also noted that homepages in the sample:
“… had 6.3 form inputs on average. 34.2% of those form inputs were not properly labeled (either via
I would not have assumed such a high average number of form fields per homepage. Although the absence of proper form input labels is the unfortunate status quo.
Average Number of Accessibility Errors by Industry
All sites were categorized into one of 29 industry types.
The best performers, with the fewest number of average accessibility issues, were:
- Government
- Personal Finance
- Non-Profit/Charity
- Law, Government, & Politics
- Social Media
The worst performers, with the greatest number of average accessibility errors, were:
- News/Weather/Information
- Home and Garden
- Style & Fashion
- Sports
- Shopping
The spread ranged from 37.2 average errors for Government (the best average performer) to 71.2 for Shopping (the worst performing class). eCommerce has some serious work to do.
Average Number of Accessibility Errors by Top Level Domain (TLD)
.gov domains were the best performers with only 19.6 errors on average, followed closely by .edu at 23.6 errors on average. This reflects the continued effort made to improve US .gov website conformity to accessibility regulations and requirements.
On the opposite end of the spectrum are .ru (72.4 errors average) and .cn domains (73.8 errors average). Make of that what you will.
Note: The Newer TLDs
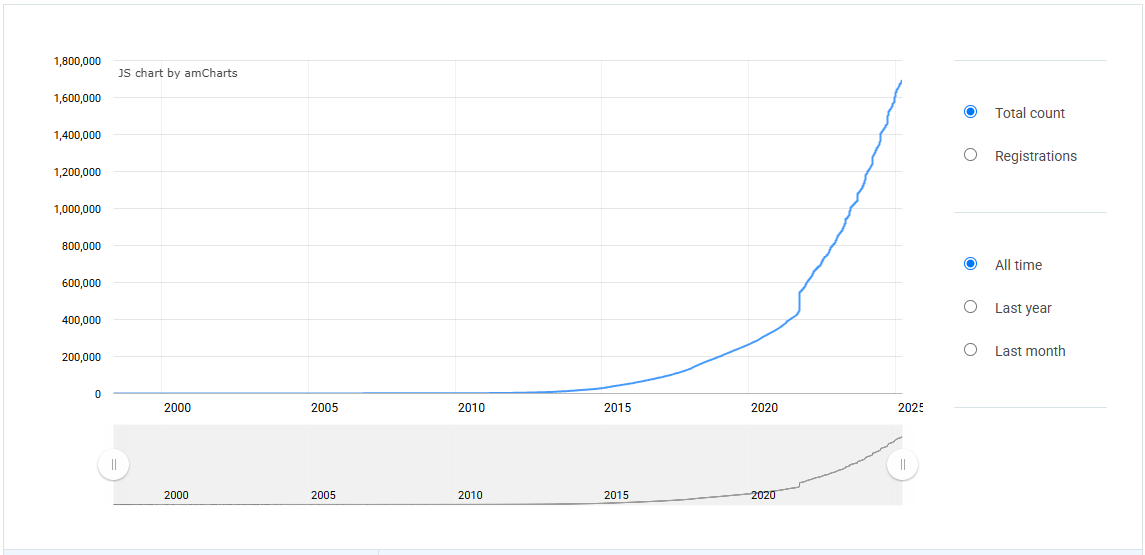
The .io TLD posted a relatively low average of only 31.8 errors. I consider this a bright spot. Most .io sites are relatively new, trend toward being tech startups and SaaS applications, and are built with contemporary tech stacks. Whether these sites are built with accessibility compliance foremost in mind, one can’t really say, but the overall accessibility outcome is better than our older ecosystem of .org and .com domain sites by a considerable margin.
Registration of .io domains over time:

Headings and Screen Readers
Despite the critical importance of headings for screen reader navigation,
“skipped heading levels were present on 39% of all pages, up from 37.9% in 2024. 9.8% of pages had no headings present at all, down from 11.3% in 2024.”
This highlights a fundamental misunderstanding among developers, content managers and website owners, regarding how assistive technologies navigate content. My unsubstantiated belief is that headings are often used merely for the aesthetic CSS styles associated with them and not their expression of hierarchical relationships within the document. Given that proper header order has search engine optimization benefits outside of the usual assistive ones, this needs to be a primary area of focus for developers, testers, information architects, etc.
Content Management Systems and Site Builders
Here the data collected is underwhelming. Many common open-source CMS solutions are represented: WordPress, Drupal, and Joomla for example. Three common page builder applications typically used with WordPress—Elementor, WPBakery and Divi—are here. However, platforms such as Wix and Squarespace are completely absent even though both appear in BuiltWith’s data for the CMS types used on the top 1 Million sites. Data on more CMS platforms should be incorporated into the 2026 data gathering effort.
Ecommerce Accessibility
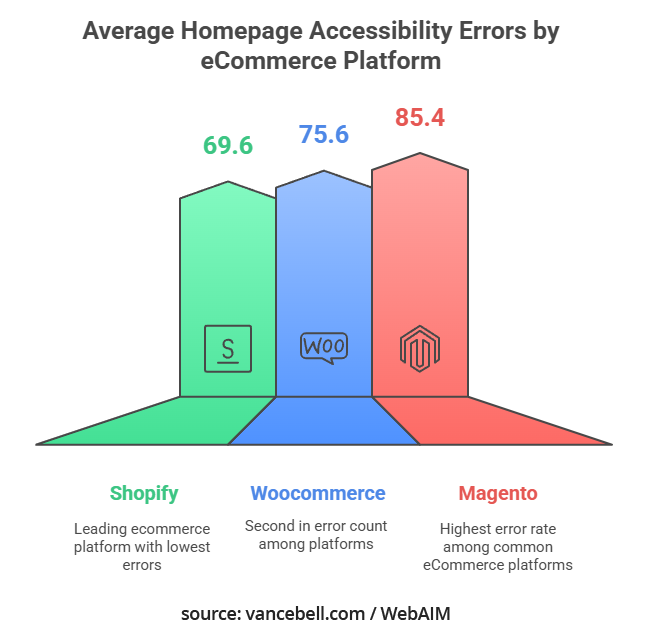
As a group, eCommerce sites show a greater than average number of accessibility errors. In fact Shopping as a category earned the highest average number of accessibility errors of all categories analyzed. Of the main three eCommerce platforms—Shopify, Woocommerce and Magento—Shopify is the leader with 69.6 average homepage accessibility errors followed by Woocommerce (75.6) and Magento (85.4). Ecommerce sites are one category most poised to benefit from accessibility improvements, but the data shows there is still a great deal of work to be accomplished there. Perhaps the profitability of making these accommodations hasn’t been explained clearly.

Page Complexity, Error Remediation and Data Skew
The gathered data shows that the most popular sites (in the top 100,000 of the 1 million tested) have 45% more page elements than the bottom 100,000 sites. This may lead to two circumstances skewing the data:
- Large pages with more elements may predictably yield greater opportunity for accessibility errors, and
- Popularity may correlate with larger website development teams, larger maintenance budgets (potentially for accessibility testing), and potentially sites with some regulatory oversight.
The first point would tend to drive up total errors on average, while the second might do the opposite.
Potential Accessibility Blind Spots
While WebAIM’s effort is very commendable, the focus on homepages means that accessibility issues common to interior pages and key site functions may not be reflected in the dataset. Below is just a “quick” pass at some of those common issues. The length of this partial list alone should convey the extent of the problems one encounters past the homepage:
Form and Checkout Processes
Multi-step forms, payment workflows, and registration processes often have:
- Missing or inadequate error messages and validation feedback
- Time-out issues that don’t accommodate users who need more time
- Required fields not properly indicated to screen reader users
- Complex CAPTCHAs without accessible alternatives
Dynamic Content and Functionality
- Infinite scrolling that makes content unreachable for keyboard users
- Content that updates without screen reader users being notified
- Modal dialogs that trap keyboard focus or aren’t properly announced
- Custom widgets (sliders, tabs, accordions) lacking proper ARIA implementation
Content-heavy Pages
- Long articles lacking proper heading structure for navigation
- PDF documents without proper tagging or structure
- Data tables missing proper headers and row/column associations
- Image-heavy galleries without adequate alternative text
Account Management Sections
- Security features (like two-factor authentication) that aren’t accessible
- Dashboard widgets that rely on visual positioning without semantic relationships
- Password requirements presented in ways screen readers can’t interpret
Search results and filtering
- Faceted search interfaces that change content without announcing updates
- Search results that can only be navigated visually
- Auto-suggest dropdowns not accessible to keyboard or screen reader users
Media-rich Sections
- Video content without captions, transcripts, or audio descriptions
- Audio content without transcripts
- Interactive visualizations and charts without accessible alternatives
Mobile-specific Issues
- Touch targets too small or positioned too close together
- Gestures without keyboard or button alternatives
- Content that depends on specific orientation (portrait/landscape)
User-generated Content
- Comments, forum posts, and other user contributions lacking accessibility review
- File uploads that don’t provide guidance on creating accessible attachments
Help and Documentation
- Support pages with inaccessible step-by-step instructions
- Contextual help that appears in ways not perceivable to all users
Legal and Policy Pages
- Dense text without proper structure for navigation
- Important information buried in hard-to-parse paragraphs
Final Thoughts
Polarization in Accessibility Performance
As the report notes “pages with fewer errors have gotten better while pages with many errors have gotten worse.” This is a disturbing trend and suggests a growing divide between sites that prioritize accessibility and those that don’t, rather than uniform improvement across the Web.
Impact of Governance
Government (.gov) and education (.edu) sites had significantly fewer errors than commercial sites. I can only think that continuing existence of legal requirements for these sites helps focus attention on their accessibility and drives down the average number of errors. Extending similar accessibility requirements to more websites would likely be beneficial and serve the greater good, while maintaining policies like the Disabled Access [Tax] Credit will help ease the financial burden for website owners.
Rising Complexity is a Risk Factor
The report mentions increases in the total number of page elements between 2019 (approximately 800) to over 1250 in 2025. Baked into this trend is a steadily rising opportunity to introduce more and greater accessibility errors. Developers should focus on simplifying page structure and reducing non-essential elements. These two actions alone would not only reduce errors, but improve site performance on average. Get more done with less in the rest of 2025 and beyond.
Regional and Language Disparities
Significant differences in error rates across TLDs and languages suggest accessibility levels might be influenced by regional regulations, development practices, or cultural awareness. Western-language sites generally performed better than others. The data for country of origin seems absent in the dataset meaning one cannot review how, for example, the developing world might be doing with these issues.
Limited Progress
The included chart showing WCAG conformance failures over seven years reveals minimal improvement (from ~98% to 94.8%), suggesting current approaches to improving web accessibility aren’t making substantial impact at scale. It would interesting if the data could be refactored to show this value for a given industry, TLD, platform, etc. to see if any noticeable trends toward improvement can be found.
Developers: Make a Minimal Accessibility Commitment
As a developer, when you are working on projects with no accessibility budget and no mandate, make at least a minimal commitment to address the low hanging fruit if you are able. Recall that the most common issues found in this review are as follows:
- Low contrast text (79.1% of pages)
- Missing alternative text for images (55.5%)
- Missing form input labels (48.2%)
- Empty links (45.4%)
- Empty buttons (29.6%)
- Missing document language (15.8%)
Most of these do not require massive effort to resolve, but they do require at least a minimal commitment. Get on board the a11y train, set up an efficient workflow that helps you through the remediation process, and work the problems. Squash these accessibility errors the same way you squash software bugs. It may not be a perfect outcome every time, but typically improved is an improvement over unaddressed. You may never meet the person you’ve helped, but that is just fine—really. Feel good about it anyways.
Wrapping Up
First:
Please take a moment and have a look at WebAIM’s original post and analysis of the 2025 data. A great deal of effort was made to provide the data and its interpretation.
As always, please let me know your thoughts in the comments below. Are you bullish or bearish on the prospects for future large scale accessibility improvements? Have you seen a trend yourself that isn’t reflected in the data? Let your fingers do the talkin’.
Happy remediation!


2 thoughts on “The State of Website Homepage Accessibililty 2025”
This report brings up a lot of mixed emotions—on one hand, it’s encouraging to see any improvement in homepage accessibility, even a 10% drop in average errors. But on the other hand, it’s disheartening that 95% of sites still fail WCAG 2 standards. It shows how far we still have to go. What really hits home is the growing divide: some organizations are clearly prioritizing accessibility, while others are falling further behind. Accessibility isn’t just a checklist—it’s a reflection of who gets to fully participate online. We can and must do better, together.
Well put Elna —
Although I didn’t mention it, I’m also a bit concerned with the level of accessibility of the increasing number of sites generated by AI “vibe coding” tools or by site owners without any understanding of accessibility using simple site builders. Much of that activity happens on sites outside of WebAIM dataset.